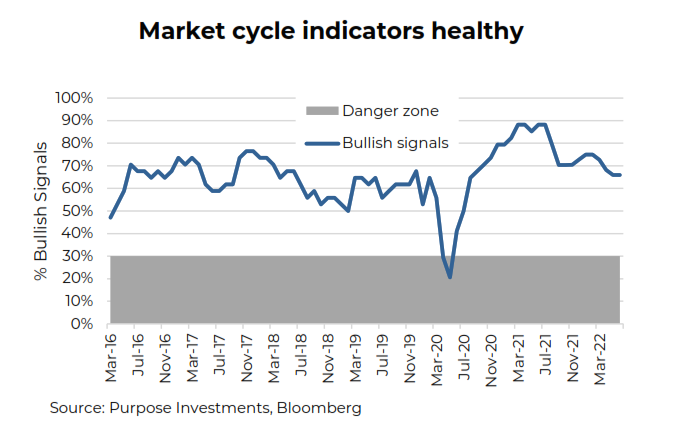
- Prices are down: The speed and magnitude of the market declines this year have pushed prices into oversold territory in the short term. Given how much negative news the markets have absorbed so far this year, even bad news that is just ‘less’ bad would likely contribute to a relief rally.
- Inflation: High inflation has remained one of the biggest market concerns and continues to embolden central banks to tighten monetary policy faster in response. This also lifts yields higher. Higher yields equal a higher discount rate, meaning valuations have to come down for equities and bonds. Hence, prices are down.
- Softening economic data:
Normally, softer economic data would raise concerns for slowing corporate earnings growth, which leads to lower equity prices. But today, softening economic data also implies less inflationary pressures, which means central banks may not be as aggressive in their tightening of financial conditions to combat inflation. That means the rising discount rate may not rise as far and that equals a move up in markets, especially since they are starting from oversold territory.
So, if bad economic news is now good for the market, what if the economic data were to improve? Well, we certainly can’t have it both ways and if we were to experience a sudden run of improving economic data, yields would likely rise faster and that would not be welcome for equity markets. Plus, that would certainly not help alleviate any of the inflation pressures. While this is possible, the current trend in the data is to the softer side.
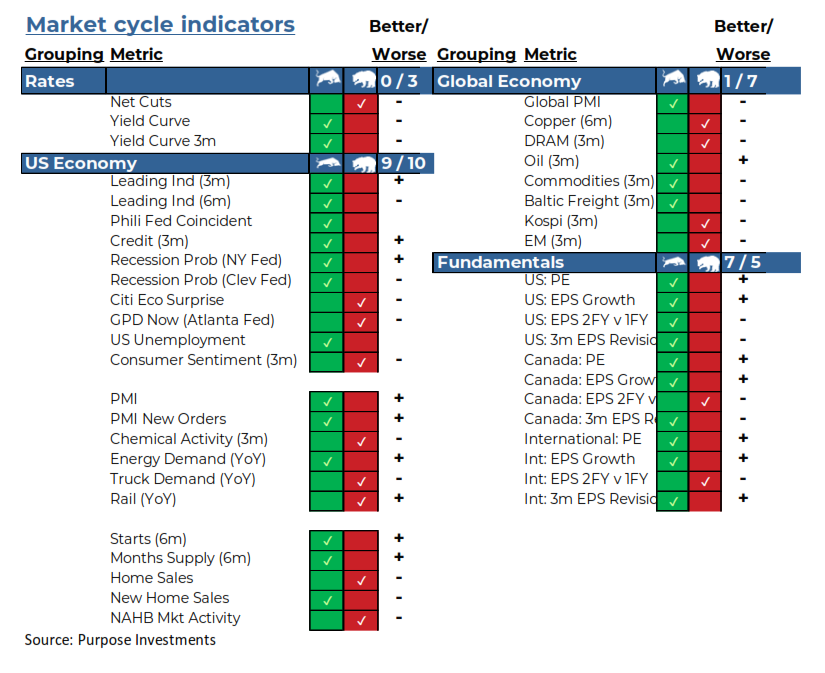
Among the indicators: Rates – Clearly central bank rate hikes is negative—perhaps this one should carry a larger weight. The yield curve remains positively sloped but it has been flattening. US Economy – Leading indicators, recession probabilities, and employment remains supportive, as does manufacturing, which is still playing a degree of catch up given past supply and fulfillment issues. Housing is starting to wobble a bit, likely due to higher financing costs and tightening financial conditions. Global Economy – The story does grow a bit more worrisome outside North America. While the signals are evenly mixed, there has been a deterioration across almost all the signals during the past month [the ‘Better/Worse’ column is whether the indicator got better or worse during the past month]. Fundamentals – These are encouraging given valuations have fallen and margins remain healthy despite rising cost inputs. However, the longer forecasts are starting to show slowing earnings growth.
So far much of the weakening economic data has been in the ‘soft categories.’ Soft economic data is typically populated with surveys, anecdotal indicators, less direct measurements of the actual economy. For instance, consumer confidence is a survey where people are asked about their spending patterns and intentions. It can be a good indicator, but it isn’t what people are actually doing necessarily. Consumer confidence has been in the dumps for a couple years now and yet the consumer has been spending away. Sometimes people say one thing and do another.
Hard economic data is actual measurements of economic activity, such as GDP, employment, and industrial activity. Perhaps it’s more reliable, but it suffers from longer lag times in reporting and is often revised after being reported. Yes, economics is a bit more of art than a science. An art with a good dose of math.
If the weaker data continues and spreads to the harder economic data, the banter around recession will start to grow louder. This may build as the year progresses and potentially become a bigger issue than inflation fears later this year. Plus, we believe margin pressure and slowing earning growth may become an issue later this year. More on that topic later…
….because for now, we are in the upside down. This softening economic data trend should start to alleviate some of the inflation and hiking fears in the market, opening the door for a potential summer rebound in risk assets. Portfolio Construction - Positioning for a bounce
One thing many investors have learned over the years, corrections often present opportunities. Sometimes those opportunities play out to be long-term strategies and sometimes the approach is simply tilted towards the tactical side of the scale. However, during a correction, we also know that the hardest thing to do when managing a portfolio is to be bold and take advantage of those opportunities. Nevertheless, no one’s timing is perfect, even the greatest portfolio managers in the world will admit to that. The best that anyone can do is stick to their investment thesis and manage risk accordingly.
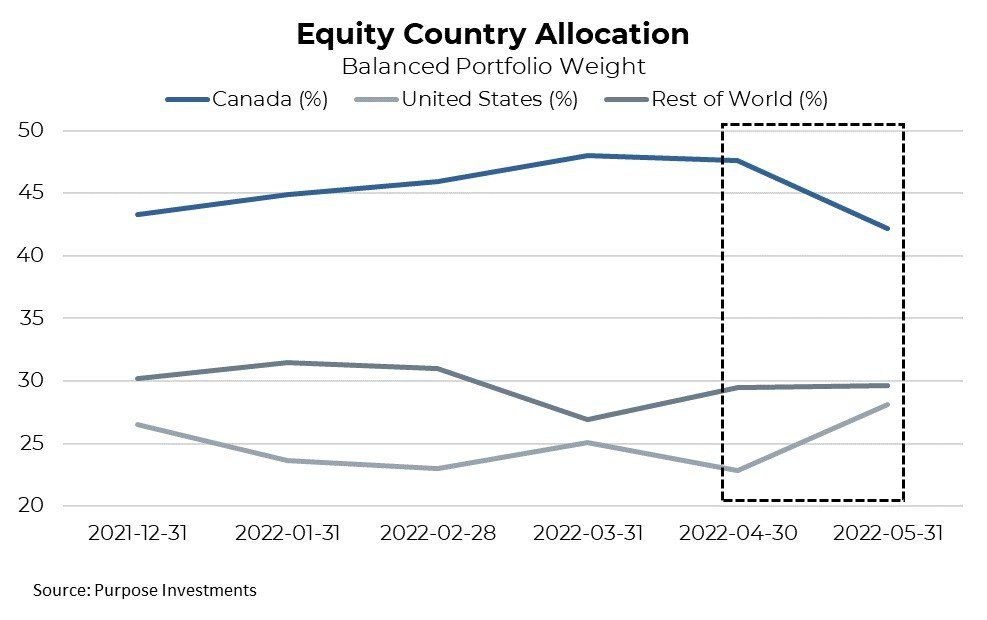
With so much in the economic world being upside down, it is challenging to have any strong conviction so far in 2022. Still, coming into the year we made the decision to overweight Canadian equities, at the peak reaching 48% of the balanced portfolio equity allocation. Some may call it a home country bias, but there were several indications that Canada was going to lead the way. Canada is a much heavier value index than our comrades south of the border and when presented with a rising rate environment. It’s a good place to take refuge. Then tensions continued to escalate between the Ukraine and Russia, which added some fuel to our resource-heavy index. Safe to say that call has been the correct one with the TSX down -1.3% and the S&P 500 down -12.9% in Canadian dollars. Plus, the portfolio’s underweight in the U.S. market was composed of two parts: the U.S. exposure in the North American dividend active fund and an equal weighted S&P 500 ETF. The fund’s U.S. holdings have a strong value/dividend tilt, which have really held up much better than the overall U.S. market. Plus, the equal weight ETF avoided the concentration risk of the broader market and has outperformed by approximately +4% year to date.
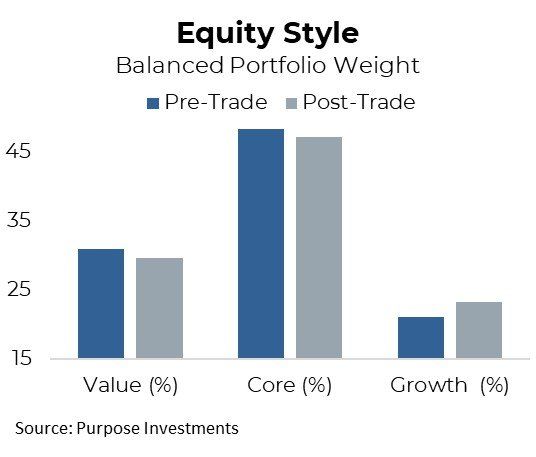
Our most recent allocation change is tactical in nature and reversed a bit of our previous positioning. Around mid-May, we trimmed Canadian equities and initiated a position in a Nasdaq 100 ETF. The decision was based on many factors, such as valuations, rate hikes being priced in, and the overall depth of the correction. But the overarching factor in the decision always comes down to how the portfolio is currently allocated. Already being underweight the beat-up U.S. market allowed us to take advantage of what we believe is an opportunity.
Remember, be greedy when others are fearful.
Fund Flows – Investors are often their own worst enemy Fund flows measure the net movement of cash into and out of pooled products such as mutual funds and ETFs. While flows do play a part in performance, especially for illiquid underlying securities the primary goal of flow analysis is gaining additional insight into where exactly investors are moving their money. Broadly speaking it’s best to look at combined flows of both mutual funds and ETFs when and where possible, as it provides the most complete overall picture. Sometimes this combined data is not as timely, or lacks enough detail, which is why ETF flow data usually is more commonplace.
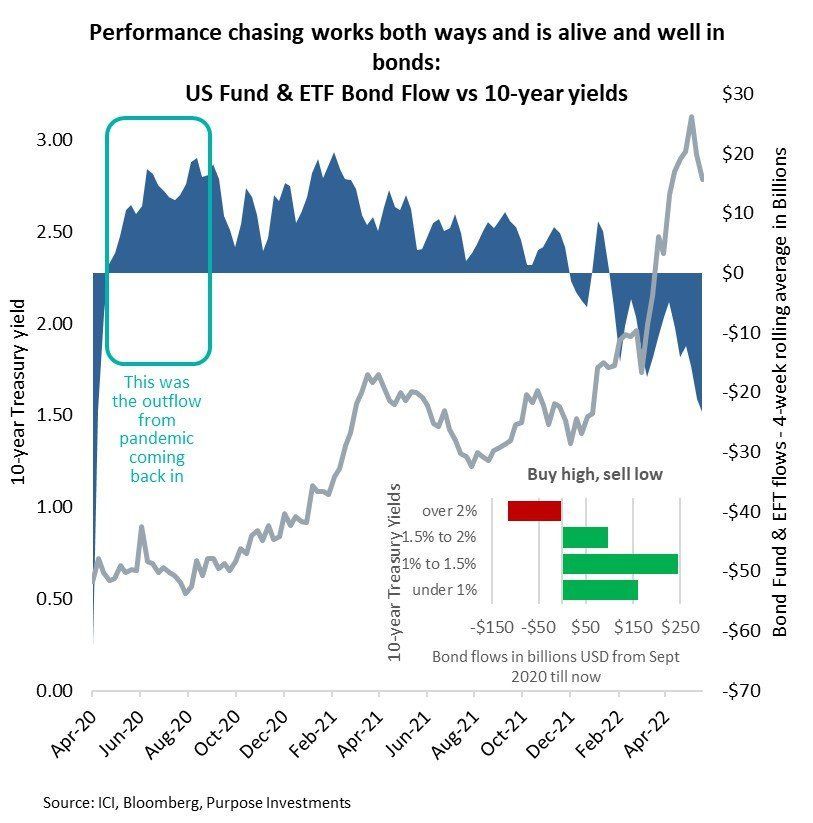
Bear markets tend to stir an urge for investors to do something, anything. More often than not they tend to trigger the fight or flight response. Behaviourally, evolution has rewarded those who usually run from stressful situations rather than face them head on. No matter how often you’ve hear in point: here’s a fun fund flow chart for bonds, it’s all U.S. data going back a few years, but still worth noting. Much of the bond buying and inflows occurred when yields were very low, below 2% or 1.5%. Now that yields are over 2%, investors are selling. This is literally buying high and selling low, which is not the best strategy for growing capital. The trend is continuing of late with estimated outflows of $9.9 billion last week and $14.8 billion the previous week.
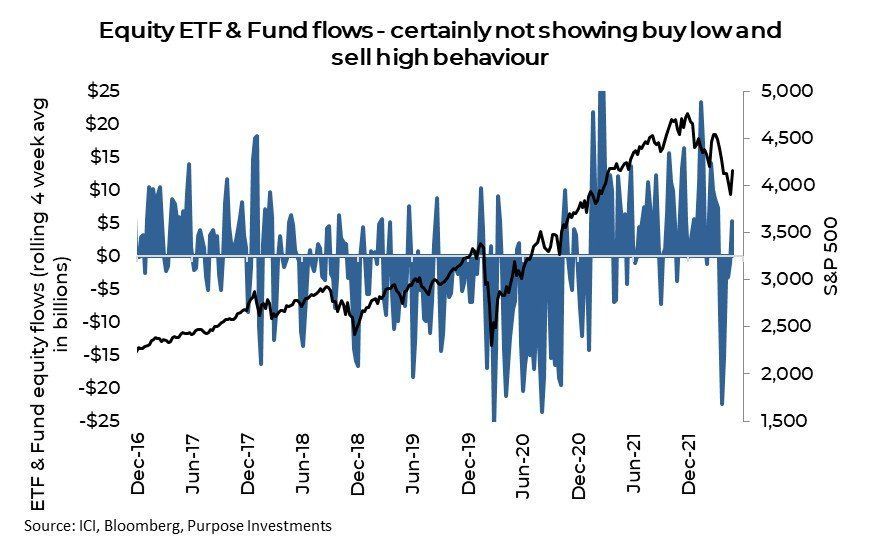
As the current equity market took hold, inflows remained resilient until April which saw very strong bear market like outflows. Since then, flows improved and recently turned slightly positive. An early sign that perhaps there is some risk appetite out there.
With inflation running hot and interest rates rising, bond investors in aggregate have been net sellers. Central banks will continue to hike rates, but much of that may already priced into the bond market. From here, where longer-term rates go is more uncertain.
The typical role in a portfolio for bonds is protection of principal, while providing some income. Recently it’s fair to say that broad fixed-income instruments failed at this goal in the short term. That’s not to say that over the long term the asset class is broken, but 2022 has not been kind to bond holders. So, what can investors do? Focus on what you can control. The certainty that the CRA will come collecting again a little less than a year from now is 100% and pre-emptive tax motivated trading does not need to be just a November/December occurrence. We believe the market has largely priced in in the bulk of the expected rate hike cycle, and the time is right to do some tax loss harvesting amongst fixed-income portion of your portfolio. With the plethora of ETFs and funds available it is easy to maintain similar exposures and crystalize any unrealized capital losses. Of course, this isn’t specific tax advice as everybody has a different unique situation, but flipping bond positions to realize a loss may have some benefits. Just keep in mind that superficial loss rules apply so ensure that any replacement fund can’t be deemed “identical property,” as in it tracks the same index just from a different fund provider.
The contents of this publication were researched, written and produced by Purpose Investments Inc. and are used by Echelon Wealth Partners Inc. for information purposes only.
This report is authored by Craig Basinger, Greg Taylor and Derek Benedet Purpose Investments Inc.
Disclaimers
Echelon Wealth Partners Inc.
The opinions expressed in this report are the opinions of the author and readers should not assume they reflect the opinions or recommendations of
Echelon Wealth Partners Inc. or its affiliates. Assumptions, opinions and estimates constitute the author's judgment as of the date of this material and
are subject to change without notice. We do not warrant the completeness or accuracy of this material, and it should not be relied upon as such. Before
acting on any recommendation, you should consider whether it is suitable for your particular circumstances and, if necessary, seek professional advice.
Past performance is not indicative of future results. The comments contained herein are general in nature and are not intended to be, nor should be
construed to be, legal or tax advice to any particular individual. Accordingly, individuals should consult their own legal or tax advisors for advice with
respect to the tax consequences to them.
Purpose Investments Inc.
Purpose Investments Inc. is a registered securities entity. Commissions, trailing commissions, management fees and expenses all may be associated
with investment funds. Please read the prospectus before investing. If the securities are purchased or sold on a stock exchange, you may pay more or
receive less than the current net asset value. Investment funds are not guaranteed, their values change frequently and past performance may not be
repeated.
Forward Looking Statements
Forward-looking statements are based on current expectations, estimates, forecasts and projections based on beliefs and assumptions made by
author. These statements involve risks and uncertainties and are not guarantees of future performance or results and no assurance can be given that
these estimates and expectations will prove to have been correct, and actual outcomes and results may differ materially from what is expressed,
implied or projected in such forward-looking statements. Assumptions, opinions and estimates constitute the author’s judgment as of the date of this
material and are subject to change without notice. Neither Purpose Investments nor Echelon Partners warrant the completeness or accuracy of this
material, and it should not be relied upon as such. Before acting on any recommendation, you should consider whether it is suitable for your particular
circumstances and, if necessary, seek professional advice. Past performance is not indicative of future results. These estimates and expectations
involve risks and uncertainties and are not guarantees of future performance or results and no assurance can be given that these estimates and
expectations will prove to have been correct, and actual outcomes and results may differ materially from what is expressed, implied or projected in
such forward-looking statements. Unless required by applicable law, it is not undertaken, and specifically disclaimed, that there is any intention or
obligation to update or revise the forward-looking statements, whether as a result of new information, future events or otherwise.
Before acting on any recommendation, you should consider whether it is suitable for your particular circumstances and, if necessary, seek professional
advice.
The particulars contained herein were obtained from sources which we believe are reliable, but are not guaranteed by us and may be incomplete. This is not an official publication or research report of either Echelon Partners or Purpose Investments, and this is not to be used as a solicitation in any jurisdiction.
This document is not for public distribution, is for informational purposes only, and is not being delivered to you in the context of an offering of any securities, nor is it a recommendation or solicitation to buy, hold or sell any security.