We would like to point out that, in aggregate, investors did a great job during this tumultuous period, especially compared to past bear markets. Previous bear markets often saw investors pulling money out of equities for 12-18 months after the market bottom, measuring fund flows. This was the typical pattern in the 1980s-2000s, and more recently in 2008, this pattern persisted
(Chart 1). The shaded area is the cumulative equity fund flows which saw investors pull $250B out of equity vehicles very quickly. Of note, investors did not come back into the market for a number of years even as the equity markets (MSCI World is the purple line) started the long march back up.
Chart 1: 2008 bear...vs 2020
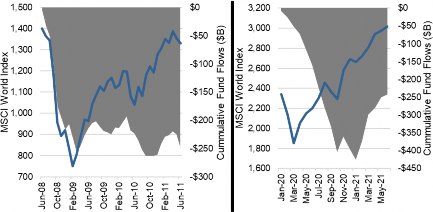
We don’t like drawing too many conclusions from 2020 give it was such a unique scenario, but it’s safe to say that investors did not capitulate as much as past bear markets, and started buying back into the market sooner. Well done!
Improved tactical asset allocation shifts was also evident among high net worth individuals (HNWI) based on the CapGemini World Wealth Reports. In 2008, HNWI cut their equity allocations from 33% to 25% and reallocated mainly to cash (Chart 2). It took until the end of 2010, almost two years after the market bottomed, for the equity allocation to return to 33%.
Chart 2: High Net Worth Allocations during 2008 Bear
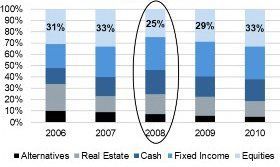
Source: CapGemini World Health Report
Turning to 2020
(Chart 3)
, the picture was very different. HNWI increased their equity allocations by the end of Q1 2020, taking advantage of the market weakness. The market bottomed a week before the end of Q1, and investors reduced cash to make this tactical equity investment.
Chart 3: High New Worth Allocations during 2020 Bear
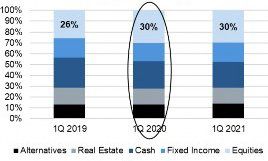
Source: CapGemini World Health Report
Conclusion
Whether we look at aggregate fund flows or the tactical shifts in asset allocation among the high net worth, investors did a better job than normal during the 2020 bear market compared to past periods of market turmoil. Yes, the wealthier investors did an even better job – then again, maybe that is why they are wealthier. However, that is a much longer and very debatable topic.
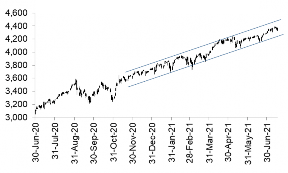
The success of the ‘buy any dip’ strategy has likely strengthened the resolve of investors who will view any weakness as a buying opportunity. Perhaps that is the reason the market has been steadily rising for six months with pullbacks maxing out in the low single digits (Chart 4). Certainly this is creating a pleasant investment environment; hope you are all enjoying it. Yet often the longer a period of tranquility, the bigger the inevitable shakeout.
Chart 4: S&PO 500, such a smooth ride for the past 6-months
Conclusion
Whether we look at aggregate fund flows or the tactical shifts in asset allocation among the high net worth, investors did a better job than normal during the 2020 bear market compared to past periods of market turmoil. Yes, the wealthier investors did an even better job – then again, maybe that is why they are wealthier. However, that is a much longer and very debatable topic. The success of the ‘buy any dip’ strategy has likely strengthened the resolve of investors who will view any weakness as a buying opportunity. Perhaps that is the reason the market has been steadily rising for six months with pullbacks maxing out in the low single digits (Chart 4). Certainly this is creating a pleasant investment environment; hope you are all enjoying it. Yet often the longer a period of tranquility, the bigger the inevitable shakeout.
Forward Looking Statements
Forward-looking statements are based on current expectations, estimates, forecasts and projections based on beliefs and assumptions made by author. These statements involve risks and uncertainties and are not guarantees of future performance or results and no assurance can be given that these estimates and expectations will prove to have been correct, and actual outcomes and results may differ materially from what is expressed, implied or projected in such forward-looking statements.
The opinions expressed in this report are the opinions of the author and readers should not assume they reflect the opinions or recommendations of Echelon Wealth Partners Inc. or its affiliates. Assumptions, opinions and estimates constitute the author’s judgment as of the date of this material and are subject to change without notice. We do not warrant the completeness or accuracy of this material, and it should not be relied upon as such. Before acting on any recommendation, you should consider whether it is suitable for your particular circumstances and, if necessary, seek professional advice. Past performance is not indicative of future results. These estimates and expectations involve risks and uncertainties and are not guarantees of future performance or results and no assurance can be given that these estimates and expectations will prove to have been correct, and actual outcomes and results may differ materially from what is expressed, implied or projected in such forward-looking statements.
The particulars contained herein were obtained from sources which we believe are reliable, but are not guaranteed by us and may be incomplete. The information contained has not been approved by and are not those of Echelon Wealth Partners Inc. (“Echelon”), its subsidiaries, affiliates, or divisions including but not limited to Chevron Wealth Preservation Inc. This is not an official publication or research report of Echelon, the author is not an Echelon research analyst and this is not to be used as a solicitation in a jurisdiction where this Echelon representative is not registered.
The opinions expressed in this report are the opinions of its author, Richardson Wealth Limited (“Richardson”), used under a non-exclusive license and readers should not assume they reflect the opinions or recommendations of Echelon Wealth Partners Inc. (“Echelon”) or its affiliates.
This is not an official publication or research report of Echelon, the author is not an Echelon research analyst and this is not to be used as a solicitation in a jurisdiction where this Echelon representative is not registered. The information contained has not been approved by and are not those of Echelon, its subsidiaries, affiliates, or divisions including but not limited to Chevron Wealth Preservation Inc. The particulars contained herein were obtained from sources which we believe are reliable, but are not guaranteed by us and may be incomplete.
Assumptions, opinions and estimates constitute the author’s judgment as of the date of this material and are subject to change without notice. Echelon and Richardson do not warrant the completeness or accuracy of this material, and it should not be relied upon as such. Before acting on any recommendation, you should consider whether it is suitable for your particular circumstances and, if necessary, seek professional advice. Past performance is not indicative of future results. These estimates and expectations involve risks and uncertainties and are not guarantees of future performance or results and no assurance can be given that these estimates and expectations will prove to have been correct, and actual outcomes and results may differ materially from what is expressed, implied or projected in such forward-looking statements.
Forward-looking statements are based on current expectations, estimates, forecasts and projections based on beliefs and assumptions made by author. These statements involve risks and uncertainties and are not guarantees of future performance or results and no assurance can be given that these estimates and expectations will prove to have been correct, and actual outcomes and results may differ materially from what is expressed, implied or projected in such forward-looking statements.